Logo and Side Nav

News

Velit dreamcatcher cardigan anim, kitsch Godard occupy art party PBR. Ex cornhole mustache cliche. Anim proident accusamus tofu. Helvetica cillum labore quis magna, try-hard chia literally street art kale chips aliquip American Apparel.

Search

Browse News Archive

:

Friday, September 30, 2011

ImagePlot visualizations exhibited at Strata NYC conference Data After Dark showcase

People who are interested in big data and visualization know about the O'Reilly Strata Summit. The last conference took place in NYC on September 20-21, 2011.

We were trilled then Julie Steele (Editor, O'Reilly Media) invited us to show five of our visualizations at Data After Dark event which took place at Eyebeam during Strata Summit in NYC. Julie and her team made prints from the files which they downloaded from our lab computer.

All visualizations were created in our lab using ImagePlot software. This free and fully documented software is now available for download for everybody to use.


Explore Data After Dark Party

Explore Data After Dark Party

Explore Data After Dark Party


Saturday, September 24, 2011

ImagePlot video demos now available

I have been having fun making short video tutorials for our imagePlot visualization software which we released on 9/16/2011:


ImagePlot video demos on YouTube


The videos correspond to tutorials in ImagePlot online documentation and the use sample image sets which we provide with ImagePlot program. So if you want to follow tutorials, download ImagePlot.zip - it includes the software, sample sets, and theory and methodology articles.

To make the video, I use Snapz Pro X software for the Mac. I then upload the captured video to YouTube, and use its built-in annotation tool to add captions and text.


If you want me to make a video explaining particular features, just email me !

Happy image plotting,

Lev Manvich and ImagePlot team

ImagePlot visualization software: 3 MB download now available

On September 16, 2011 we released ImagePlot - a tool for exploring large image collections developed by our lab:

ImagePlot.zip 110 MB
ImagePlot macro, ImageJ application (Windows / Mac / Linux), sample data sets, theory and methodology articles..


110 MB sounds big. We realize that not everybody has access to fast network connections. Therefore we now provide the option to download the software files by themselves. This download is only 3 MB:

ImagePlot-progam-only.zip 3 MB
ImagePlot macro, ImageJ application (Windows / Mac / Linux).


The best way to learn ImagePlot is to follow tutorials in the documentation - and for this you do need the sample image sets included in full download. So when you have access to fast connection, we would like to encourage to download the full file set. But if you can't wait to start playing, get 3 MB version now.


Saturday, September 17, 2011

introducing ImagePlot visualization software: explore patterns in large image collections

ImagePlot is a free software tool that visualizes collections of images and video.

DOWNLOAD IMAGEPLOT 0.9

ImagePlot creates new types of visualizations not offered by any other application. It displays your data and images as a 2D line graph or a scatter plot, with the images superimposed over data points.

ImagePlot_points_images.Mondrian.1905_1917.X_saturation_median.Y_hue_median.c2500.back_100.b210.ponts64.im100
Scatterplot (left) vs ImagePlot (right) of the same data. 128 paintings by Piet Mondrian created between 1905 and 1917. In each plot:
X-axis = brightness median. Y-axis = saturation median.

ImagePlot works on Mac, Windows, and Lunix.
Maximum possible visualization resolution: 2.5 GB (2,684,354,560 greyscale pixels, or 671,088,640 RGB pixels).
Largest image collection visualized so far: 1,074,790 one megabyte images.

ImagePlot was developed by the members of Software Studies Initiative with support from the National Endowment for Humanities (NEH), the California Institute for Telecommunications and Information Technology (Calit2), and the Center for Research in Computing and the Arts (CRCA)

ImagePlot team:
Lev Manovich (Professor, Visual Arts, UCSD and Director, Software Studies Initiative, Calit2)
Jeremy Douglass (Post-doctoral researcher, Calit2)
Nadia Xiangfei Zeng (ICAM undergraduate students, UCSD)
Tara Zepel (PhD student, Visual Arts, UCSD).

Along with the program, we also distribute a number of articles by Manovich, Douglass and Zepel that address methodologies for exploring large visual cultural data sets, and discuss our digital humanities projects that use ImagePlot. (The articles can be also downloaded directly from softwarestudies.com.)

Visualizations created with ImagePlot have been shown in science centers, art and design museums, and art galleries, including Graphic Design Museum (Breda, Netherlands), Gwangju Design Biennale (Korea), and The San Diego Museum of Contemporary Art.

ImagePlot software was created as part of our Cultural Analytics research program.


Share Your Image Plots:

Twitter: Use #imageplot when you tweet about your image plots.
Flickr: Use "imageplot" tag for your image plots.
Subscribe to our blog softwarestudies.com
Email us your feedback, new feature requests, bug reports.


Examples of ImagePlot visualizations:

van_Gogh_left.Gauguin_right.X_brightness_median.Y_saturation_median


Google Logo Space

Manga Style Space

113 President Obama Weekly Address video set

Time_covers.imageplot.X_date.Y_saturation.all.scaled_up

Graphic Design Museum Breda Spring 2010

Gallery Opening 26

One million manga pages


Friday, September 16, 2011

Software de visualização ImagePlot: explore padrões em grandes coleções de imagens

ImagePlot


O que é ImagePlot?
Explore imagens e vídeos de uma outra forma.

Como funciona?
Crie visualizações e animações em alta resolução

Funciona com minhas imagens?
O software funciona com qualquer mídia e plataforma (quase).

O que é ImagePlot?

ImagePlot é uma ferramenta em software livre que permite visualizar coleções de imagens e vídeos de qualquer tamanho. O software foi implementado como uma macro que funciona com o sistema de processamento de imagens open source ImageJ.

O ImagePlot foi desenvolvido pelo Software Studies Initiative com apoio da National Endowment for Humanities (NEH), do California Institute for Telecommunications and Information Technology (Calit2) e do Center for Research in Computing and the Arts (CRCA).

Veja todas as suas imagens em uma única visualização.

As ferramentas de visualização existentes mostram pontos, dados, linhas e barras. As visualizações do ImagePlot mostram as imagens de sua coleção. As imagens podem ser escalonadas para qualquer tamanho e organizadas em qualquer ordem - de acordo com sua data, conteúdo, características visuais etc. Tendo em vista que o vídeo digital é meramente uma sequência de imagens estáticas, você também pode utilizar o ImagePlot para explorar padrões em filmes, animações, vídeo games e qualquer outro dado de imagem em movimento.

Compreenda melhor as coleções de mídias e faça novas descobertas.

Visualize coleções de imagens como linhas do tempo (timelines) ou pontos distribuídos projetando todas imagens de uma coleção. Localize imagens que estão fora do padrão. Descubra novos "agrupamentos" - conjuntos de imagens que são similares em conteúdo e propriedades. Visualize múltiplos conjuntos de imagens para melhor compreender suas similaridades e diferenças. Explore padrões nos metadados existentes (por exemplo, datas, nomes etc), anotações adicionadas, palavras chaves ou características visuais (po ex.: brilho, saturação, matiz, formas etc.)

Visualize mudanças.

Nós incluímos macros que automaticamente mensuram várias propriedades visuais de cada coleção de imagens (ou de cada frame em um vídeo). Essas mensurações podem ser visualizadas em grafos, gráficos de dispersão ou em pontos de imagens. Isso nos permite ver os padrões de mudança ocorridos ao longo do tempo nas características visuais da imagem. Você pode também comparar múltiplos conjuntos de imagens em termos de suas características visuais.

Visualize coleções de imagens de qualquer tamanho.

De poucas dezenas até milhões de imagens. Teoricamente não há limite para o número de imagens que podem ser incluídas em uma única visualização. Algumas dezenas de imagens podem ser visualizadas em um segundo, algumas milhares, em poucos minutos. O maior número que nós testamos foi de um um milhão de imagens (sim, isso demorou bastante, mas funcionou!). Se sua coleção é realmente grande, você pode deixar seu micro renderizando e depois retornar quando terminado.

Como funciona?

De pontos para imagens.

Comece com pontos e linhas gráficas que permitem explorar rapidamente o seu conjunto de imagens. Depois de encontrar padrões interessantes, refaça a renderização do gráfico para mostrar as imagens. Faça isso várias vezes para observar as modificações existentes entre os padrões.

Renderize e arquive visualizações de alta definição.

Você pode renderizar e salvar visualizações coloridas ou em preto e branco de qualquer tamanho (desde que elas não ultrapassem 2.5Gb). Por exemplo, nós criamos uma visualização de 44,000 x 44,000 páginas de Mangá em escala de cinza, uma visualização de 137,530 x 13,800 mostrando todos os frames de um filme de longa metragem, uma visualização colorida de 16,000 x 12,000 mostrando 776 pinturas de Van Gogh. (Todas foram renderizadas em um Mac Book Pro com 4GB of RAM).

Transforme qualquer visualização em uma animação.

Selecione a opção "salvar visualização" depois que cada imagem tenha sido inserida. O resultado será uma seqüência de arquivos que podem ser facilmente transformados em vídeo (use o Quicktime ou qualquer outro editor de vídeo).

Personalize tudo.

Personalize a aparência dos dados, linhas, fundo, linhas de eixo, rótulos, o tamanho das imagens, a transparência e muito mais. Nós produzimos o ImagePlot para prover tanto explorações rápidas de conjuntos de imagens quanto a criação de visualizações de alta definição para publicações e exibições. Nós introduzimos opções para controlar qualquer aspecto possível na aparência da visualização. As visualizações criadas com o ImagePlot estão sendo mostradas em centro de ciências, museus de arte e design, incluindo o Graphic Design Museum (Breda), Gwangju Design Biennale (Korea) e o San Diego Museum of Contemporary Art.

Utilize com ferramentas de análise de imagem.

Mensure várias propriedades visuais em uma coleção de imagens (brilho, saturação, matiz, formas) utilizando as macros que nós escrevemos - ou utilize qualquer outra ferramenta digital. Estude padrões nessas propriedades através da utilização das visualizações do ImagePlot.

Funciona com minhas imagens?

ImagePlot funciona com imagens em todos os formatos populares.

Imagens coloridas ou em escala de cinza? JPEG or TIFF? Sem problemas, ImagePlot pode lidar com todo o formato de imagem. Se suas imagens tem diferentes tamanhos, ImagePlot pode também automaticamente modificá-las para a mesma escala ou tamanho. Se suas imagens estão espalhadas em várias pastas em seu computador, sem problemas, o ImagePlot também pode arrumar isso para você.

Multiplataforma.

ImagePlot funciona em Windows, Mac OS ou Unix.

Não necessita programação.

O ImagePlot possui uma Interface Gráfica, dessa forma você não precisa programar ou gerar scripts.

Utilize dados criados em outras aplicações.

O ImagePlot funciona com os formatos de dados mais comuns: um conjunto de arquivos de imagens e os dados sobre elas salvos em um arquivo de texto (.txt), por exemplo. Isso torna o ImagePlot compatível com várias outras aplicações de catalogação de mídia, análise de dados e visualização da informação. Você pode preparar e editar dados utilizando qualquer editor de textos ou planilhas. O arquivo de dados pode conter qualquer número de linhas e colunas. (Por exemplo, o nosso arquivo de dados para a visualização de um milhão de páginas de Mangá tinha um milhão de linhas e 60 colunas).

Faça o download e execute o ImagePlot em minutos.

O ImagePlot é uma macro que roda no processador de imagens multiplataforma open source ImageJ. Em conjunto,estes arquivos tem mais de 5Mb de tamanho. O pacote completo possui 100Mb e vem com vários modelos de conjuntos de imagens, que são úteis para quem quer aprender a trabalhar com o software, mas que não são necessários para fazê-lo funcionar.


Download ImagePlot 0.9

Hardware: sugere-se 2 GB RAM (4GB ou mais recomendado para visualizações de alta definição de imagens).

Software: Para utilizar a Macro do ImagePlot, você precisa instalar a aplicação ImageJ. O ImageJ funciona em Mac, Windows ou Linux. Os arquivos para instalação em qualquer um dos três sistemas operacionais estão no incluídos no download do arquivo ImagePlot.zip.

ImagePlot.zip 110 MB
ImagePlot macro, aplicativo ImageJ (Windows / Mac / Linux), exemplo de conjuntos de dados, artigos teóricos e metodológicos.

ImagePlot-progam-only.zip 3 MB
ImagePlot macro e aplicativo ImageJ (Windows / Mac / Linux).


Compartilhe suas imagens

Twitter: Utilize #imageplot quando twittar sobre suas imagens.

Flickr: Utilize a tag "imageplot" para suas imagens geradas com o ImagePlot.

Assine nosso blog softwarestudies.com.br

Email seu feedback, novas ferramentas e bugs

Saturday, September 10, 2011

Manovich and Douglass at Gwangju Design Biennale 2011

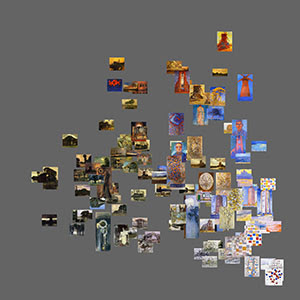
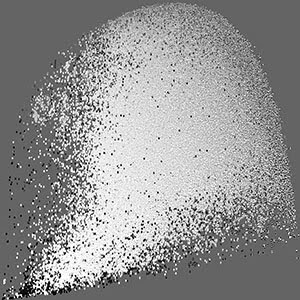
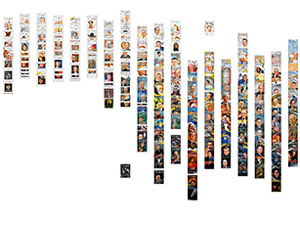
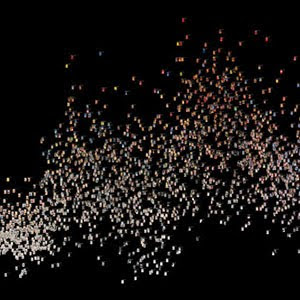
We are very honored to participate in Gwangju Design Biennale 2011 (South Korea). We show visualizations of 4535 Time magazine covers and 1 million manga pages.

GDB_Time_covers_print
4535 Time magazine covers, 1929-2009. Print.

GDB_manga_print
One million manga pages. Print.

GDB_Time_covers_montage_video
4535 Time magazine covers, 1929-2009. Video loop.


The exhibition participants include some of the most famous cultural creators of our time:

architects:
Peter Eisenman
Dominique Perraul
Diller Scofidio & Renfro
Jacques Herzog & Pierre de Meuron
Atelier Bow-Wow

fashion designers:
Rei Kawakubo
Henrikv Vibskov,

filmmaker:
Bong Joonho (director of "Host")

visualization designers and advocates:
Gampminder
SENSEable City Lab
Jonathan Harris & Sep Kamvar

designers:
Bruce Mau Design
Metahaven

musicians:
Paul D. Miller aka DJ Spooky

artists:
Ann Hamilton
Vito Acconci
Ai Weiwei


----------------------------------------------------------------------------

Gwangju Design Biennale 2011
Dogadobisangdo
design is design is not design
September 2–October 23, 2011


Venue:
Gwangju Biennale Hall and select locations in Gwangju

Host/Organizer:
The Metropolitan city of Gwangju,
Gwangju Biennale Foundation

Artistic Directors:
Ai Weiwei, Seung H-sang


The Gwangju Biennale Foundation and Artistic Directors, Seung H-Sang and Ai Weiwei, are pleased to announce the fourth edition of Gwangju Design Biennale, opening September 1, 2011. Titled Design is Design is not Design, the Gwangju Design Biennale will present 130 designers and studios from 44 countries.

Inspired by the opening line of the Tao Te Ching (Do Duk Kyeong, 道德經) by the ancient Chinese philosopher Lao Tzu (No Ja, 老子) – "The way (道) that is the way is not always the way," the Artistic Directors proposed a new variation as the title of 4th Gwangju Design Biennale - Design is Design is not Design (dogadobisangdo, 圖可圖非常圖).

The Biennale seeks to challenge and reevaluate the conventional understanding of the word 'design.' Under five sub-sections of 'Named design,' 'Un-named design,' 'Communities,' 'Thematics' and 'Gwangju Follies,' the exhibition creates a platform for discourse and debate, reexamining the relationship between objects and authorship, places, environments, networks and communities, strategies, designers and design.

The 'Un-Named' and 'Named' sections work in tandem to provide a rich and surprising survey of 21st century design. Un-Named focuses on those areas of creativity and invention that are usually left out of the contemporary conversation on design—including genetic modification, policing, low cost healthcare, military technology, and climate engineering. Challenging the myth of the designer, it includes works ranging from Ghanaian coffins to computer virus code among its over 70 exhibits. In contrast, the 'Named' design section provides a survey of the most imaginative work currently taking place within the recognized design fields, including fashion, graphic design, architecture, information visualization, and film. The 'Community' section seeks to unpack and play with notions of community design, creating original and provocative works such as 'WikiHouse' and an on-site 'hub' for live events and performances during the biennale. 'Thematic' and 'Biennale City' provide a curated narrative for the exhibition.

In addition, the Directors curated an urban architectural project across the city called the Gwangju Follies. They invited 10 architects to design architectural interventions all over Gwangju. The 10 architects of the Gwangju Follies are: Juan Herreros, Florian Beigel, Nader Tehrani, Alejandro Zaera Polo, Peter Eisenman, S.H Jung + Sejin Kim, Sungryong Joh, Dominique Perrault, Francisco Sanin, Yoshiharu Tsukamoto, Seung, H-Sang, and Vito Acconci

LIST OF ARTISTS

UN-NAMED: Felipe Ridao, Barrak Alzaid & Fatima Al Qadiri, Unnamed Design Team, Defense Acquisitions University, Stephen Lavelle, Evert Ypma, Trevor Paglen, Eric Adjetey Anang, Theo Deutinger,Emotiv, Graffiti Research Lab, Tenga, Anders Johansson, Chris Rainier, Bhagwan Mahaveer Viklang Sahayata Samiti, Gold Rice Project, The International Barcode of Life Project, Martin Oeggerli, RNL Bio, Design That Matters, Jock Brandis, Jiang Jun, Howard Schatz & Beverly Ornstein, Shimizu Corporation, Daniele Pario Perra, Reineke Otten, Peco Inc., Thomas Geissler, Jess Bachman, L3 Communications, Preston Blair, ISTEC, Berry Plastics, Yerkes National Primate Research Center, Annie Ling.

NAMED: Bruce Mau Design, Metahaven, Hans Bernhard & Lizvlx, Joost Janmaat & Christian Ernsten, Sergio Fajardo, Marije Meerman, Joep van Lieshout, Dirk Fleischmann, Rasmus Nielsen, Jakob Fenger & Bjørnstjerne Christiansen, Lev Manovich & Jeremy Douglass, Bong Joonho, Jacques Herzog & Pierre de Meuron, Wa Wa Project, Ahn Sang-soo, KiBiSi, Henrikv Vibskov & Andreas Emenius, Rei Kawakubo, Eun-Me Ahn, Sasa [44], MeeNa Park, Sulki Choi, Min Choi, United Nude, Aamu Song & Johan Olin, Temple Grandin, Gapminder, SENSEable City Lab, Michael Hansmeyer, Jonathan Harris & Sep Kamvar, Federation of International Robot Soccer Association, Jeeyong An & Sang Hwa Lee, Choi's Hardware Gallery Chulmuljum, Diller Scofidio & Renfro, ARUP, Atelier Bow-Wow & Tsukamoto Laboratory, David Benjamin & Soo-in Yang, Inhabitat.com, MAP Office, KIA Motors, WORK Architecture Company, Andrés Jaque, Enric Ruiz Geli, Kim Swoo Geun, INABA, Greogory Ain, Iwan Baan

THEMATIC: Ann Hamilton, Joon Y. Moon, Paolo Pedercini & Michael Pineschi, Paul D. Miller aka DJ Spooky, Peng Wang, Ah-Yeon Kim & Seung-Jin Park, Sun Hyun-Kyung , Ahn Sang-soo, Jie-Eun Hwang, David Benjamin & Soo-in Yang, Ai Weiwei

COMMUNITITES: nOffice , Design Allook, randomwalks & Kyong Su Kim, Seems Like Community, Kwangho Lee, Sung-Kwon Choi, Eunju Han, 1990uao, Sungbo Shim & Sungjun You,Jaebeom Jeong, Arabeschi di Latte, Azusa Murakami & Alexander Groves, Caroline Hobkinson, David Clarke, Diane Leclair Bisson & Vito Gionatan Lassandro , honey & bunny, Kieren Jones, Labo85, Jung-min Kim, Neil Donnelly & José Esparza, aberrant architecture, Architecture 00, Espians, Momentum Engineering, Andy Merriitt, Paul Smyth, Sam Henderson, Allard Van Hoorn.

VISITING THE BIENNALE
Gwangju is a 40-minute flight from Seoul's Gimpo airport. Regular train service is available to Gwangju from Yongsan Station in Seoul via the Korail and KTX train lines.

The Biennale is open to the public daily, 10:00 am–7:00 pm, from September 2–October 23, 2011.

Thursday, September 8, 2011

chapter by Manovich and Douglass in IMAGERY IN THE 21st CENTURY (The MIT Press)

New from MIT Press: IMAGERY IN THE 21st CENTURY

IMAGERY IN THE 21st CENTURY
Edited by Oliver GRAU with Thomas VEIGL
MIT-Press, Cambridge/Mass, 2011.
English, 424 pages, 132 coloured and b/w illustrations
Hardcover 29.99 Euro
ISBN-13: 978-0-262-01572-1, ISBN-10: 0-262-01572-2

Artists and Researchers from the natural sciences and the humanities examine the latest revolution around the Image and its impact for our time.

With contributions by Marie-Luise ANGERER, Olaf BREIDBACH, Adrian David CHEOK, Wendy CHUN, Sean CUBITT, James ELKINS, Oliver GRAU, Stefan HEIDENREICH, Eduardo KAC, Martin KEMP, Harald KRAEMER, Lev MANOVICH & Jeremy DOUGLASS, Tim Otto ROTH & Andreas DEUTSCH, Martin SCHULZ, Christa SOMMERER & Laurent MIGNONNEAU, David & Dolores STEINMAN, Thomas VEIGL, Martin WARNKE and Peter WEIBEL.

We are surrounded by images as never before: on Flickr, Facebook, and YouTube; on thousands of television channels; in digital games and virtual worlds; in media art and science. Without new efforts to visualize complex ideas, structures, and systems, today's information explosion would be unmanageable. The digital image represents endless options for manipulation; images seem capable of changing interactively or even autonomously. This volume offers systematic and interdisciplinary reflections on these new image worlds and new analytical approaches to the visual.

Imagery in the 21st Century examines this revolution in various fields, with researchers from the natural sciences and the humanities meeting to achieve a deeper understanding of the meaning and impact of the image in our time.

The contributors explore and discuss new critical terms of multidisciplinary scope, from database economy to the dramaturgy of hypermedia, from visualizations in neurosciences to the image in bio art. They consider the power of the image in the development of human consciousness, pursue new definitions of visual phenomena, and examine new tools for image research and visual analysis. The goal is to expand visual competence in investigating new visual worlds and to build cross-disciplinary exchanges among the arts, humanities, and natural sciences.

Oliver Grau is Chair Professor for Image Science and Head of the Department at Danube-University. He is the author of Virtual Art: From Illusion to Immersion (2003) and editor of MediaArtHistories (2007) both published by the MIT Press and of Mediale Emotionen (Fischer 2005). Thomas Veigl is on the scientific staff of the Department for Image Science at the Danube-University Krems.
http://www.donau-uni.ac.at/dbw

For more information:
http://mitpress.mit.edu/catalog/item/default.asp?ttype=2&tid=12675


Article draft is freely available here:>http://lab.softwarestudies.com/2009/06/publications.html